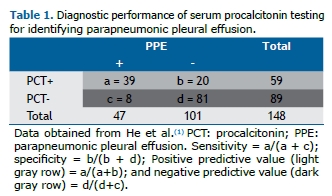
PRACTICAL SCENARIOInvestigators studied the diagnostic accuracy of serum procalcitonin levels in diagnosing parapneumonic pleural effusions (PPE) and differentiating it from other causes of pleural effusions. They found that procalcitonin had a positive predictive value (PPV) of 66% and a negative predictive value (NPV) of 91%.(1)
PPV AND NPV OF DIAGNOSTIC TESTSIn the previous article(2) we discussed two common features of diagnostics tests, sensitivity and specificity, which are important characteristics that describe the accuracy of a test. In this article, we focus on important features of a diagnostic test that help us understand how well a new test diagnoses a disease based on the results of the gold standard: PPV and NPV.
The PPV of a diagnostic test is the proportion of individuals who test positive to the new test and have the disease according to the gold standard (the proportion of true positives). When a diagnostic test has a high PPV, there is a high probability that a patient has the disease being investigated when the patient has a positive test.
The NPV of a diagnostic test is the proportion of individuals who test negative to the new test and do not have the disease according to the gold standard (the proportion of true negatives). When a test has a high NPV, there is a high probability that a patient does not have the disease being investigated when the patient has a negative test. In our example, the PPV was 66% (39/59), and the NPV was 91% (81/89), according to the results of the new test among 148 individuals (Table 1).

The PPV and the NPV of a new test depend on the prevalence of the disease in the population; thus, their results will change across populations with higher or lower prevalence of the disease when compared with the population where the test is first reported. If the prevalence of the disease is high in a given population, PPV increases and NPV decreases. Thus, the results of predictive values are not fixed characteristics of the test and cannot be generalized across populations with different prevalences of the disease.(3) There is an easy way to calculate PPV and NPV, based on Bayes' theorem, using previously reported results and taking into account the local disease prevalence.(2)
PPV and NPV are also important indicators when screening the general population. A screening test with high sensitivity and specificity may still have low PPV if the prevalence of the disease is low in that population. For example, when screening for cancer in asymptomatic adults, if the NPV of the test is high, negative results are helpful to rule out the presence of the disease; however, if the PPV is low, a positive result has a higher probability of being a false positive.
PPV and NPV are more useful than sensitivity and specificity for clinicians because they estimate the probability of the disease (or its absence), given the test result. In the next, final part of this series about diagnostic tests, we will discuss likelihood ratios and ROC curves.
REFERENCES1. He C, Wang B, Li D, Xu H, Shen Y. Performance of procalcitonin in diagnosing parapneumonic pleural effusions: A clinical study and meta-analysis. Medicine (Baltimore). 2017;96(33):e7829. https://doi.org/10.1097/MD.0000000000007829
2. Ferreira JC, Patino CM. Understanding diagnostic tests. Part 1. J Bras Pneumol. 2017;43(5):330. https://doi.org/10.1590/S1806-37562017000000330
3. Altman DG, Bland M. Diagnostic tests. 2: predictive values. BMJ. 1994;309(6947):102. https://doi.org/10.1136/bmj.309.6947.102


